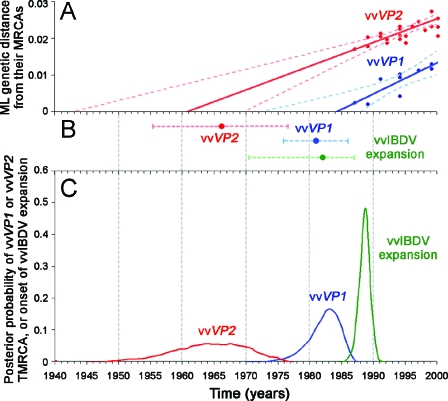
FIG. 3.
Estimations of TMRCA of both genome segments of vvIBDV and onset of its expansion under different approaches. (A) TMRCA estimations of vvfVP2 and the site-stripped vvVP1 data set with the LR approach. The dotted lines and the solid lines represent 95% CIs and best-fit values, respectively. (B) TMRCA estimations of vvfVP2 and the site-stripped vvVP1 data set, as well as the onset of vvIBDV expansion with the ML approach. The dotted lines and the solid dots represent the 95% CIs and best-fit values, respectively. (C) TMRCA estimations of vvVP2 and vvVP1, as well as the onset of vvIBDV expansion, with the BMCMC approach. The posterior distribution of vvVP2 TMRCA represents pooled BMCMC samples of the vvfVP2 and vvpVP2 data sets (BEAST), while that of vvVP1 TMRCA represents pooled BMCMC samples of the original vvVP1 data set under a relaxed clock (MULTIDIVTIME) and the site-stripped vvVP1 data set under a strict clock (BEAST). The time axes of the three panels are drawn to the same scale.

