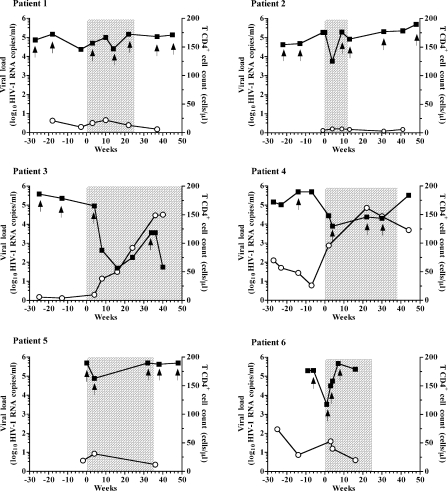
FIG. 1.
Evaluation of plasma HIV-1 load (log10 RNA copies/ml) (filled squares) and CD4+ T-cell counts (cells/μl) (open circles) before, during, and after the treatment including ENF for the six patients studied. HIV-1 RNA levels were measured by a quantitative RT-PCR assay, and CD4+ T-cell counts were measured by flow-activated cytometric assay. The chronology of the follow-up is indicated in weeks on the x axis. The beginning of the treatment including ENF is referred to as week 0, and the sampling times preceding ENF introduction are indicated with negative values. Plasma samples analyzed by phenotypic assay and by sequencing are marked in the graph with arrows. The time of treatment including ENF is shaded.

