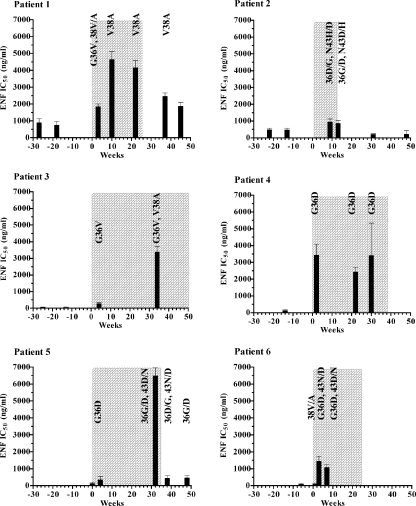
FIG. 2.
Evolution of phenotypic ENF susceptibility. ENF susceptibility of recombinant viruses expressing envelope proteins of plasma virus populations sampled at different time points for each patient was determined in a single-cycle assay. Columns represent mean IC50 values to ENF of at least three independent experiments (bars represent standard errors). The chronology of the follow-up is indicated on the x axis in weeks, and the time of treatment including ENF is shaded. HR1 resistance mutations harbored by each plasma virus population are indicated.

