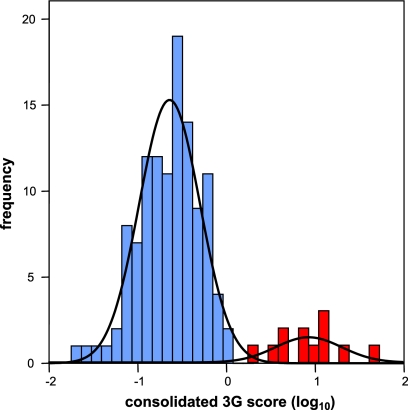
FIG. 2.
The consolidated 3G scores reflect a bimodal distribution. The bimodal distribution of the consolidated 3G scores [(#GG→GA/#consensus GG)/(#mutations/#nucleotides sequenced)] was fitted by a mixture of two normal distributions utilizing maximum likelihood, giving estimated distributions with means ± SD of −0.277 ± 0.151 (blue shaded bars; subsequently defined as NH sequences) and 0.417 ± 0.151 (red partially shaded bars; subsequently defined as HM-3G sequences), respectively. The presence of a population mixture was highly significant (P < 0.0005; likelihood ratio test).

