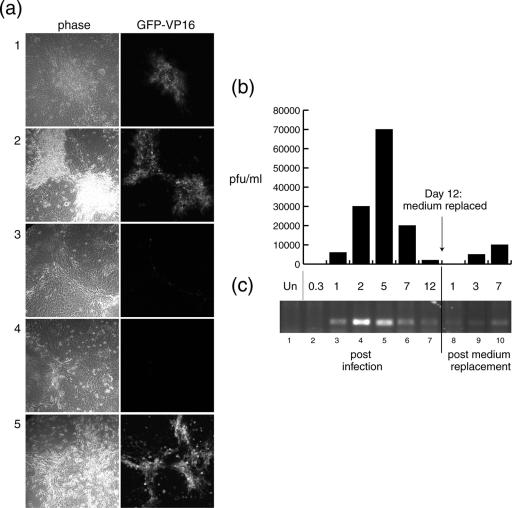
FIG. 1.
HSV-1 suppression in MDBK cells. MDBK cells were infected with an MOI of 0.02 of HSV-1 [v44]. (a) Plaque progression was monitored by confocal microscopy on live cells. Images represent 2 (panels 1), 5 (panels 2), and 12 (panels 3) dpi. At 12 dpi, the medium was replaced with fresh medium in a population of cells, which were then imaged at 1 (panels 4) and 7 (panels 5) days post-medium replacement. (b) Samples of infected cell medium were harvested at the times indicated (x axis of the histogram), and their titers were determined on Vero cells, counting plaques after 3 days. Virus yield is expressed in PFU/ml (y axis). (c) Total (cellular/viral) DNA was extracted from cells (at the time points indicated) and quantified, and PCR was performed to amplify the ICP0 gene. As a negative control, DNA from uninfected cells (Un) was amplified for the absence of the ICP0 band (lane 1).

