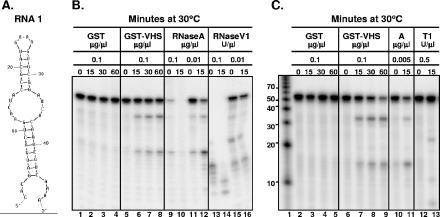
FIG. 1.
Comparison of the cleavage pattern of RNA 1 produced by GST-vhs fusion protein with those generated by RNases A, T1, and V1. (A) Secondary structure of the RNA 1 oligonucleotide as predicted by the mfold program. (B) Either GST (0.1 μg/μl; lanes 1 to 4) or GST-vhs fusion protein (0.1 μg/μl; lanes 5 to 8) as well as two different concentrations of RNase A (0.1 μg/μl, lanes 9 and 10; 0.01 μg/μl, lanes 11 and 12) and RNase V1 (0.1 U/μl, lanes 13 and 14; 0.01 U/μl, lanes 15 and 16) were incubated with 5′-end-labeled RNA 1 substrate. Aliquots were removed at the indicated times (in minutes; top of gel) and analyzed as described in the text. (C) Either GST (0.1 μg/μl; lanes 2 to 5) or GST-vhs fusion protein (0.1 μg/μl; lanes 6 to 9) as well as RNase A (0.005 μg/μl; lanes 10 and 11) and RNase T1 (0.5 U/μl; lanes 12 and 13) were incubated with 5′-end-labeled RNA 1 substrate for the time intervals (in minutes; top of gel) shown and analyzed as for panel B. Lane 1, 5′-end-labeled Decade RNA markers. The lengths of the fragments (in nucleotides) are reported on the side.

