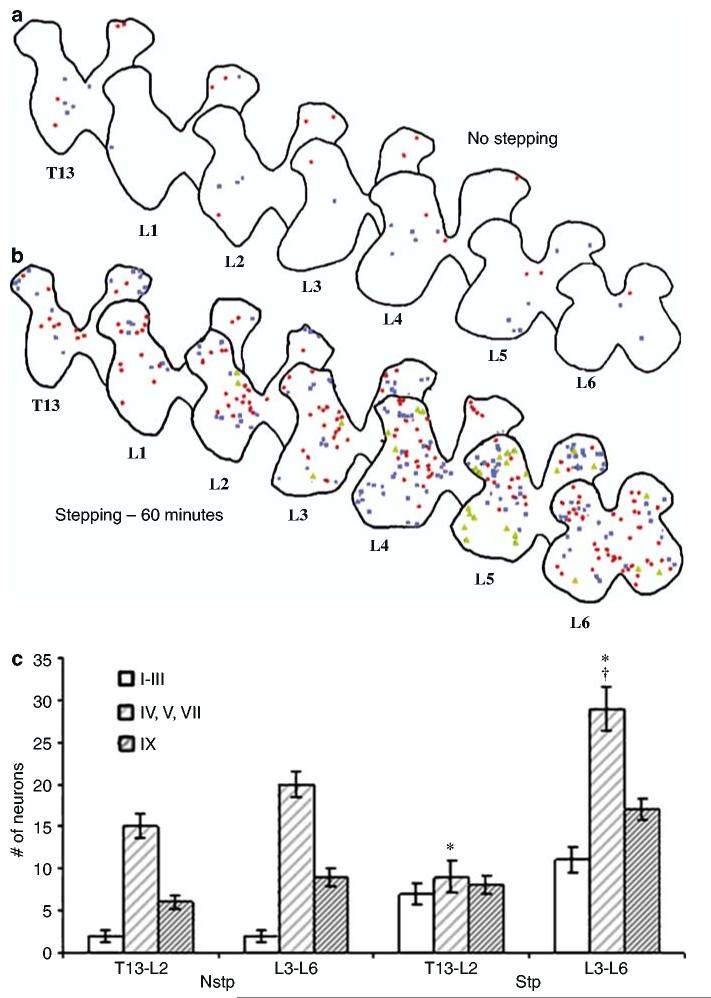
Figure 3.
Overall distribution of FOS+ neurons in the adult rat lumbar spinal cord. FOS+ neurons in Nstp rats appear to be diffuse, with no definitive organization seen in the rostrocaudal direction (a). After 60 min of treadmill stepping, the number of FOS+ neurons gradually increased in the rostrocaudal direction (b). Symbols indicate intensity of FOS staining: high (red circles), medium (blue squares), low (green triangles). Scale bar for (a) and (b) = 300 μm. Histogram of Nstp and Stp rats with respect to the number of neurons in the DH (laminae I–III), CC (laminae IV, V, VII), and VH (lamina IX) regions (c). FOS+ neurons were significantly higher in laminae IV, V, and VII in Stp rats only (cross). Within the Stp rats FOS+ neurons significantly increased in the rostral to caudal spinal cord in laminae IV, V, VII, and IX (asterisks)

