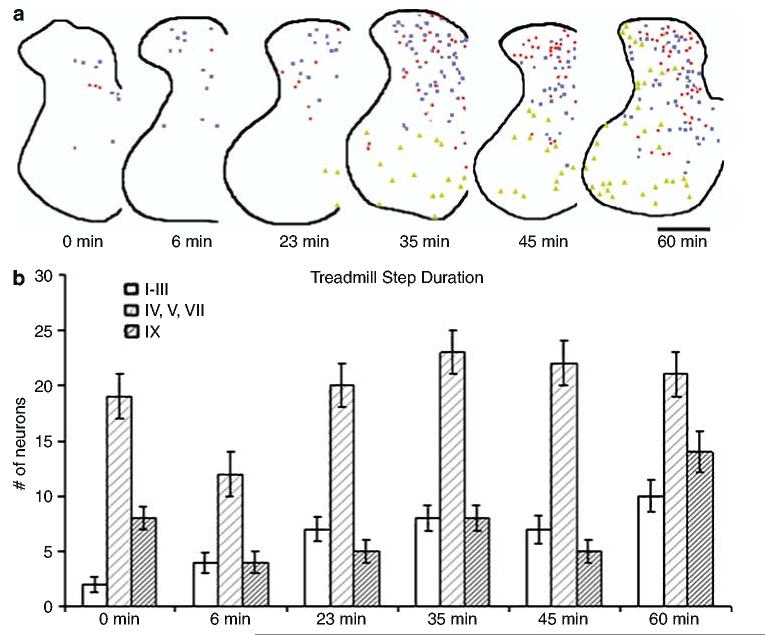
Figure 4.
Dorsoventral distribution of FOS+ neurons relative to duration of treadmill stepping. With an increasing duration of treadmill stepping there was not only an increase in number of FOS+ neurons in the DH but also a gradual appearance of VH cells positive for FOS (a). Symbols indicate intensity of FOS staining: high (red circles), medium (blue squares), low (green triangles); black line outlines the gray matter of the spinal cord section. Scale bar = 300 μm. Laminae I–V, VII, and IX were chosen to demonstrate the trend of FOS+ neurons increasing with duration of treadmill stepping in the dorsoventral direction (b)

