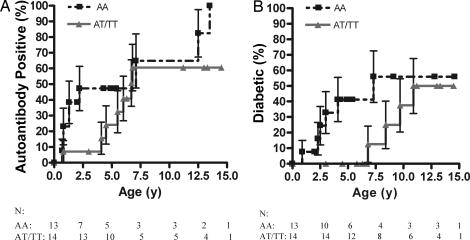
Fig. 3.
Haplotype sharing and insulin genotype survival curves. Shown is progression to anti-islet autoantibody positivity (A) and type 1 diabetes (B) in DR3/4-DQ8 siblings sharing both HLA haplotypes with their sibling probands stratified by genotypes of the insulin gene at the HphI polymorphism. The survival curves represent the high-risk genotypes (AA; n = 13) versus the lower-risk genotypes (AT, TT; n = 14). Error bars represent the SEM.

