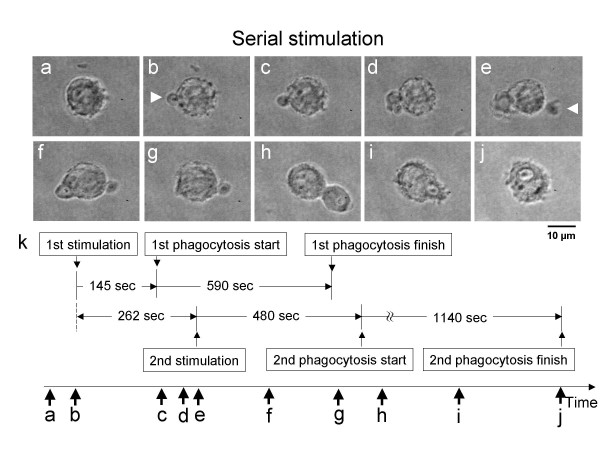
Figure 3.
Time course of serial stimulation. Micrographs before stimulation (a), after first stimulation (b), after first phagocytosis started (c, d), after second stimulation started (e, f), after first phagocytosis was complete (g), second phagocytosis started (h, i), and after second phagocytosis was complete (j). Schematic explanation of time-course of series stimulation (k). White arrows in micrographs indicate the position of zymosan.

