Fig. 4.
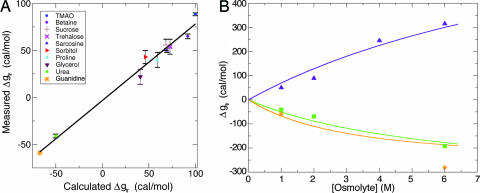
Comparison between calculated and measured Δgtr values for osmolytes. (A) Δgtr values, calculated from the model, are plotted against experimentally determined values from Table 1. Good agreement is apparent. The linear regression line (solid line) is given by Δgtrmeasured = 0.81 Δgtrcalculated − 3.2, with correlation coefficient 0.99. Data points corresponding to the 10 osmolytes in Fig. 1 are annotated in Inset. (B) Calculated Δgtr values on higher osmolyte concentrations (>1 M) are plotted against available experimental data for sarcosine (indigo triangles), urea (green squares), and guanidine (orange asterisks). Solid lines were drawn from model-based Δgtr values, extended beyond 1 M osmolyte concentrations.

