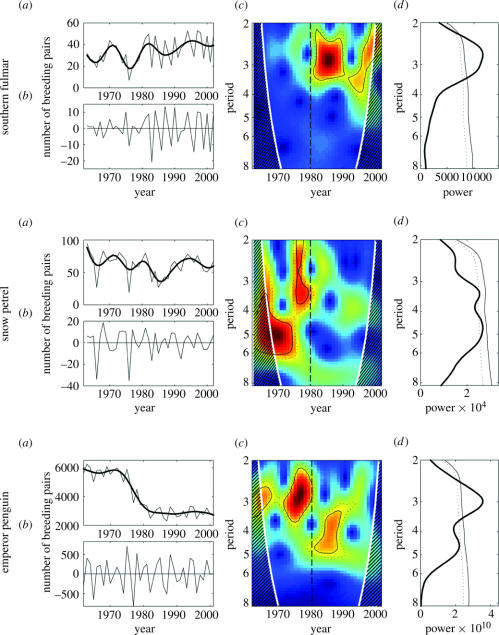
Figure 1.
(a) Annual variation of the number of breeding pairs for southern fulmars, snow petrels between 1963 and 2002, and emperor penguins between 1962 and 2002, at Dumont d'Urville, Terre Adélie, Antarctica (thin line). The thick line represents the low-pass filtered times-series (see § 2). (b) Data used for the analyses (difference between the unfiltered and low-pass filtered times-series of figure (a)). (c) Local wavelet power spectrum of breeding population sizes. The y-axis was in log 2 scale. The thick black contour is the 5% significance level and the dotted black contour is the 10% significance level calculated with a bootstrap method (see § 2). The white contour indicates the cone of influence, and the dashed area stands for the region where zero padding has reduced the variance. The local wavelet power spectrum gives a measure of the variance distribution of the time-series according to time and for each periodicity; high variability is represented by red colour, whereas blue colour indicates a weak variability. The dark dashed lines at 1980 were a visual help. (d ) Global wavelet power spectrum of interannual variability (2–8 years) of breeding pairs of the three species. The dotted and dashed black lines are, respectively, the 5% and 10% significance levels.

