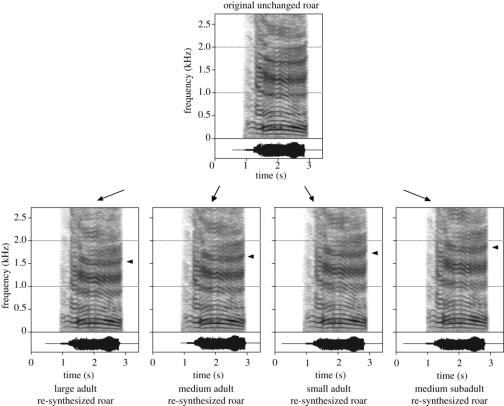
Figure 2.
Re-synthesized stimuli used in playback experiments. Diagram shows spectrograms of a roar from one of the four stag exemplars, displayed as originally recorded (upper section) and in four re-synthesized roars corresponding to VTLs of 75.8, 71, 67 and 63.2 cm (lower section). The arrow indicates the position of an individual formant, which increases in frequency as apparent VTL decreases from large adult to medium subadult (full details in text).

