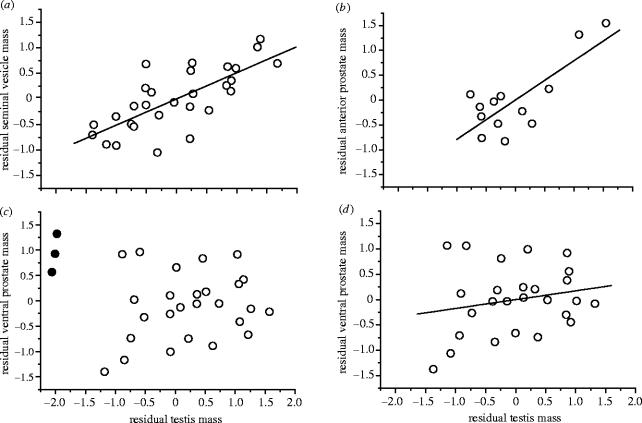
Figure 2.
Residual plots (after controlling for body mass) of log-transformed accessory gland masses against log-transformed testis mass. Residuals have been calculated manually from the phylogenetically corrected GLS regression equation (see text for explanation): (a) seminal vesicles, n=29, λ=0.952, partial r=0.65, t=4.36, p=0.0002; (b) anterior prostate, n=13, λ=0, partial r=0.72, t=3.31, p=0.008; (c) ventral prostate, n=29, λ=0.997, partial r=0.34, t=1.86, p=0.07 (filled circles represent Notomys species known to have unusual reproductive anatomy, see §4); (d) ventral prostate, residuals recalculated after fitting the GLS regression line excluding the three unusual Notomys species, n=26, λ=0.976, partial r=0.53, t=3, p=0.006. Regression lines for the residual plots (a), (b) and (d) have been fitted by ordinary least squares.

