
Figure 4.
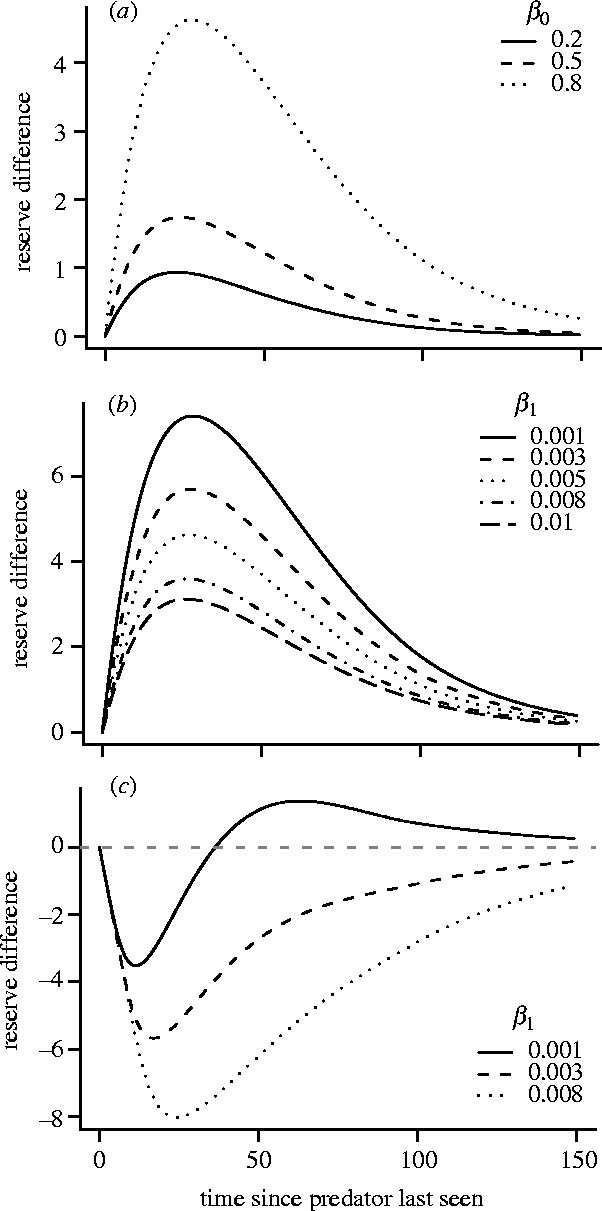
Trajectory of mean reserves after a brief exposure to a predator. In each case reserves are at their asymptotic level x** before exposure. Figures plot the subsequent deviation from x**. In all cases β(z) is given by equation (3.1). (a), (b) A(0)=0.1 and A(z)=0.001 for z≥1 and (c) A(z)=0.05β(z) for all z. In (a) x**=36.95, 38.23 and 53.64 for β0=0.2, 0.5 and 0.8, respectively. In (b) x**=46.62, 50.70, 53.64, 56.97 and 58.75 for β1=0.001, 0.003, 0.005, 0.008 and 0.010, respectively. In (c) x**=54.17, 65.63 and 81.28 for β1=0.001, 0.003 and 0.008, respectively.