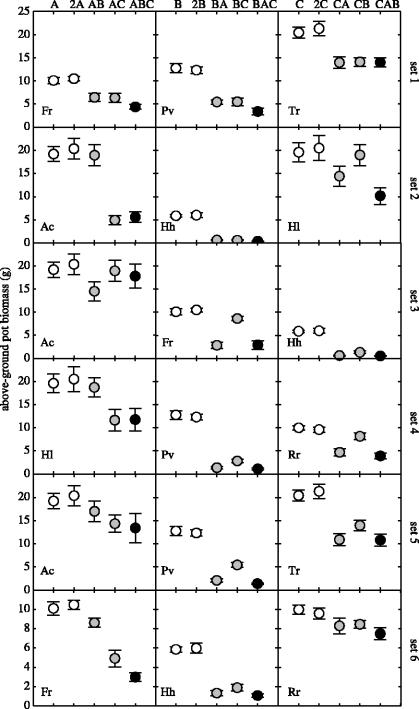
Figure 1.
Above-ground biomass of target species per pot with standard error bars (n=10). Each panel row represents one three-species set. Every panel displays data for single- and double-density monoculture (A and 2A, respectively; white dots), pairwise competition (AB and AC, grey dots) and the three-species mixture (ABC, black dot). The first to third panel of each row refer to species A, B and C, respectively, with the species abbreviation given in the lower left corner (see §2 for species names).

