
Figure 6.
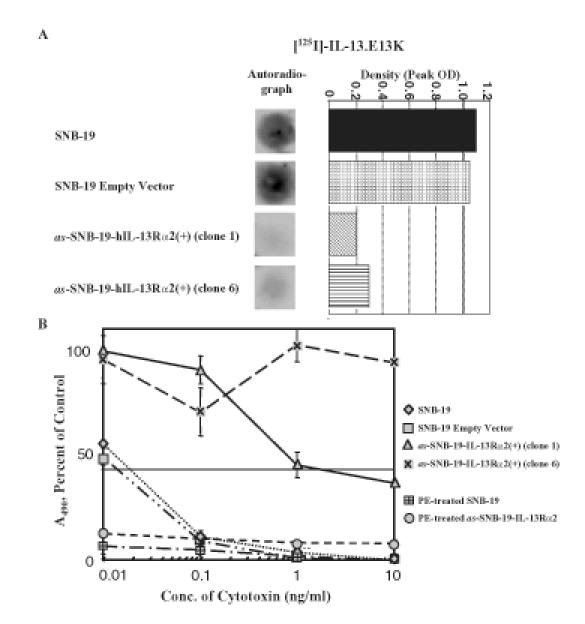
(A) Autoradiography and histogram of peak densities of IL-13 binding sites in SNB-19 parental cells, SNB-19 mock-transfected, and in as-SNB-19-hIL-13Rα2(+) clones treated with labeled IL-13.E13K. Each experiment was repeated at least four times and the results shown are a representative sample of the experiments. (B) Cytotoxicity assay using IL-13.E13K-PE38QQR cytotoxin or wild-type PE in SNB-19 parental cells, SNB-19 mock-transfected, and in as-SNB-19-hIL-13Rα2(+) clones 1 and 6. Vertical bars represent SD.