
Figure 2.
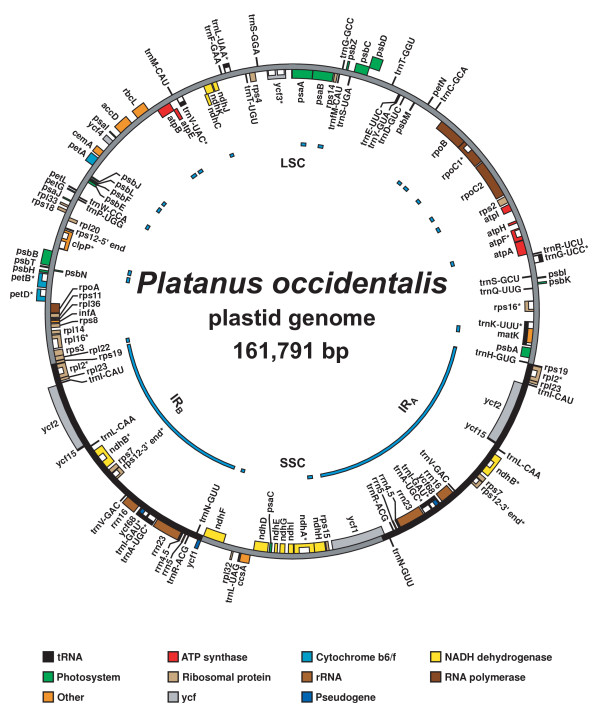
Plastid genome map of Platanus occidentalis (Platanaceae). Map of the plastid genome of Platanus occidentalis (Platanaceae), showing annotated genes and introns. Asterisks (*) after the gene names indicate the presence of introns; the introns themselves are denoted by white boxes within genes. Within the genome map, the inverted repeat regions (IRA and IRB) are depicted by the solid black bars, and the large and small single-copy regions (LSC and SSC) are depicted by the solid gray bars. Regions that were conventionally sequenced are indicated by the blue bars to the inside of the genome map.