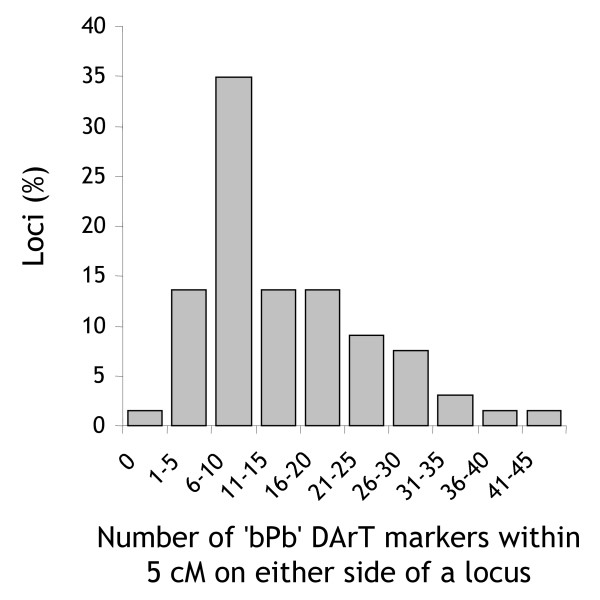
Figure 7.
Number of 'bPb' DArT loci linked to loci affecting agricultural traits. Histogram of the number of 'bPb' DArT loci within 5 cM on either side of 66 loci affecting agricultural traits. The positions of these loci were defined by SSR, RFLP or STS markers that were incorporated into the consensus map and had previously been identified to be closely linked to agricultural traits (Additional Files 11, 12).

