
Figure 2.
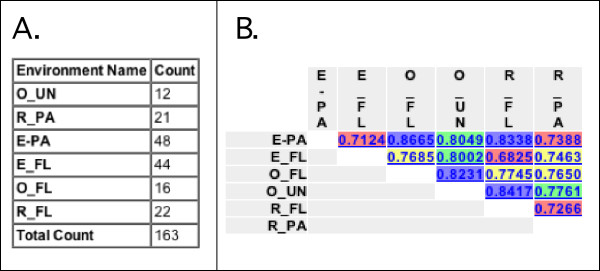
Screenshots of analysis results. For the environment names, the letter before the underscore indicates whether the sequences were from the Columbia River (R), its estuary (E), or the adjacent coastal Ocean (O). The letters after the underscore indicate whether the sequences were from the particle-attached (PA), free-living (FL) bacteria or from unfiltered water (UN). A) Result of running the Environment Counts Analysis option with Use abundance weights set to No, so that the counts represent the number of OTUs rather than the total number of clones evaluated (which would sum to 236 instead of 163). B) Result of running Environment Distance Matrix. The values are colored by quartile; values in the 0–25% range are red, 25–50% are yellow, 50–75% are green, and 75–100% are blue.