
Figure 5.
A graphic illustration of ligand-AR and ER cross-talk in the prostate cells.
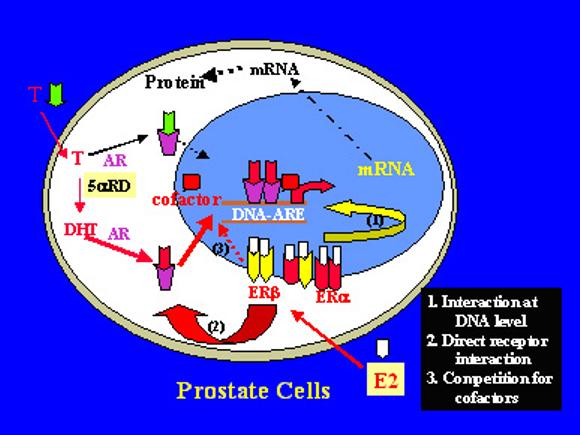
A graphic illustration of ligand-AR and ER cross-talk in the prostate cells. T – testosterone, E2 – estrogens, and 5αRD - 5α-reductase.
Official websites use .gov
A
.gov website belongs to an official
government organization in the United States.
Secure .gov websites use HTTPS
A lock (
) or https:// means you've safely
connected to the .gov website. Share sensitive
information only on official, secure websites.
A graphic illustration of ligand-AR and ER cross-talk in the prostate cells.
A graphic illustration of ligand-AR and ER cross-talk in the prostate cells. T – testosterone, E2 – estrogens, and 5αRD - 5α-reductase.