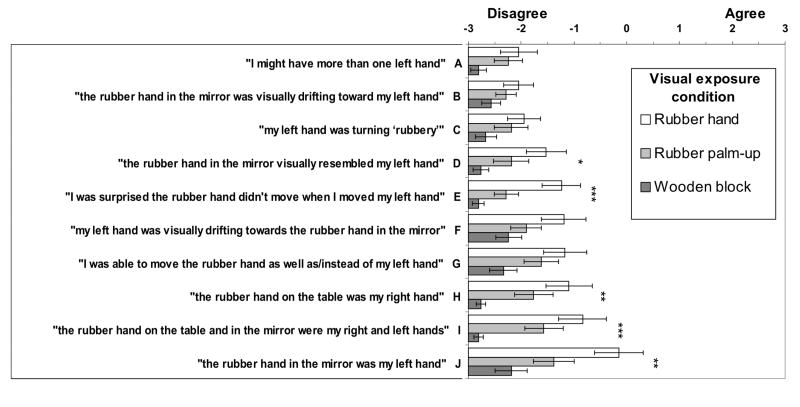
Figure 4.
Questionnaire results showing the ratings of subjective aspects of the ‘rubber hand illusion’ during the visual exposure period. The questions are arranged vertically in ascending order of the mean rating of agreement reported in the ‘rubber hand’ condition. Significant differences in one-way ANOVAs between conditions for each question considered separately, are indicated by asterisks as follows: * = p < .05; ** = p < .01, *** = p < .001. Bars show mean ± SE.

