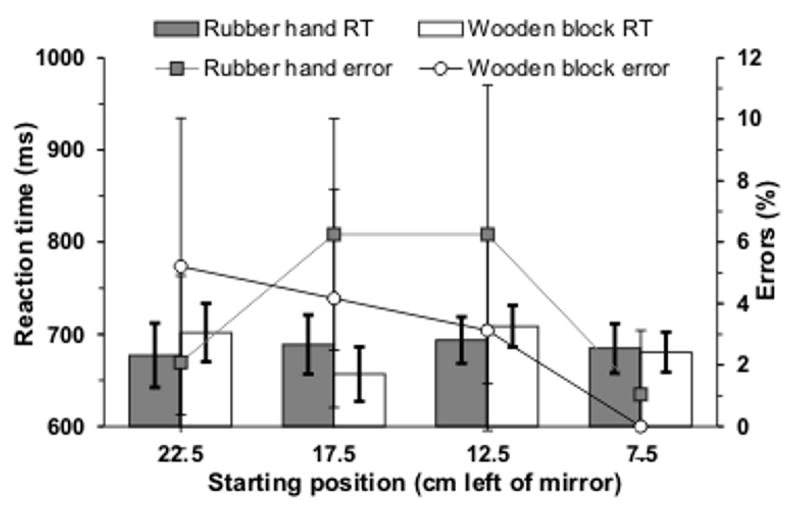
Figure 8.

Performance on the visual discrimination / Go-Nogo task in Experiment 5. Grey columns and filled grey squares – mean (± SE) RT and percent errors (both misses and false alarms) respectively in the rubber hand condition. White columns and open circles – mean (± SE) RT and percent errors (both misses and false alarms) respectively in the wooden block condition.
