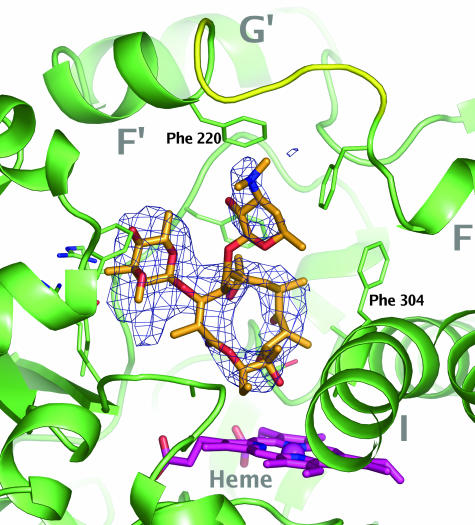
Fig. 4.
Erythromycin binding to CYP3A4. Erythromycin is shown in orange stick representation. The heme is shown in magenta. Secondary structure and stick representations of side chains within 4 Å from the ligand are shown in green. A possible conformation for the disordered loop connecting helices F and F′ is shown in yellow. The mesh represents a Fo − Fc difference map contoured at 4.5 σ calculated in the absence of ligands by using the program AutoBUSTER (19).

