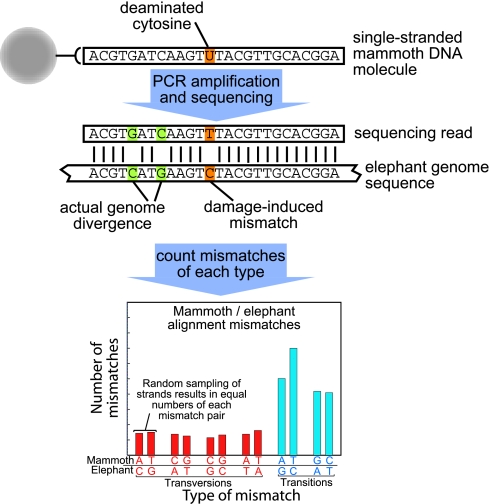
Fig. 2.
Schematic illustration showing how 454 sequencing captures individual single-stranded mammoth molecules. When these are compared with elephant sequences, any reciprocal base-equivalent differences between the genomes will be present in statistically equal numbers across many reads. This is illustrated by the two G–C and C–G differences shown in green. Any modification in the ancient DNA, for example a deaminated C that yields U (orange), will yield an excess of differences relative to the reciprocal difference, as seen for the T–C vs. A–G differences below.

