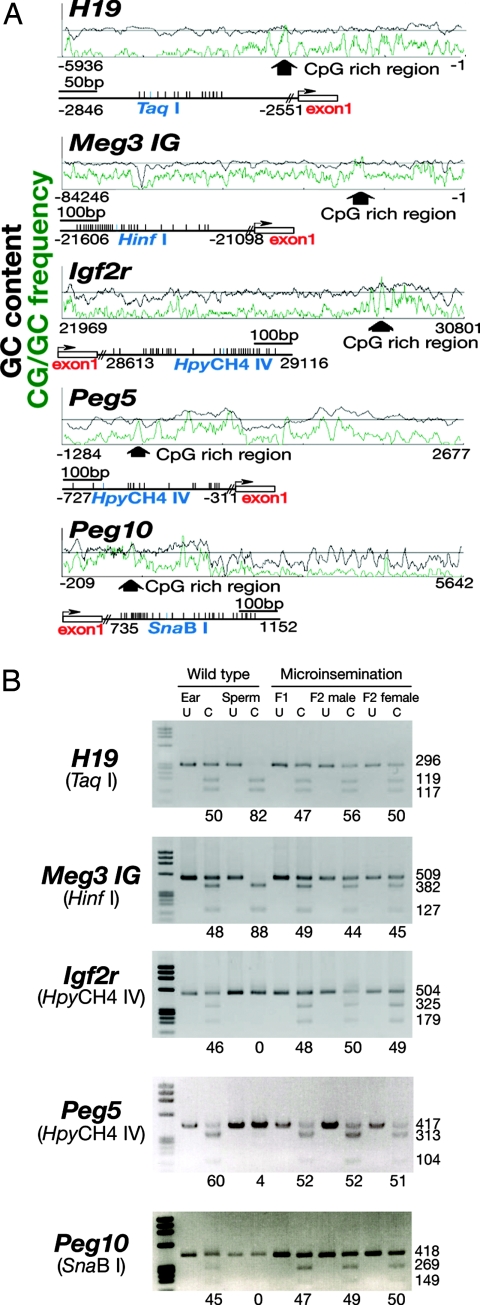
Fig. 2.
COBRA of genomic DNA from F1 and F2 pups derived from in vitro microinsemination. (A) Schematic diagram of the analyzed regions. (B) DNA methylation status of the analyzed locus. DNA was amplified by specific primers and the PCR products were digested with the indicated restriction enzymes. The percentage of methylation, which was estimated by the intensity of individual bands, is indicated below the gels. U, uncleaved; C, cleaved.

