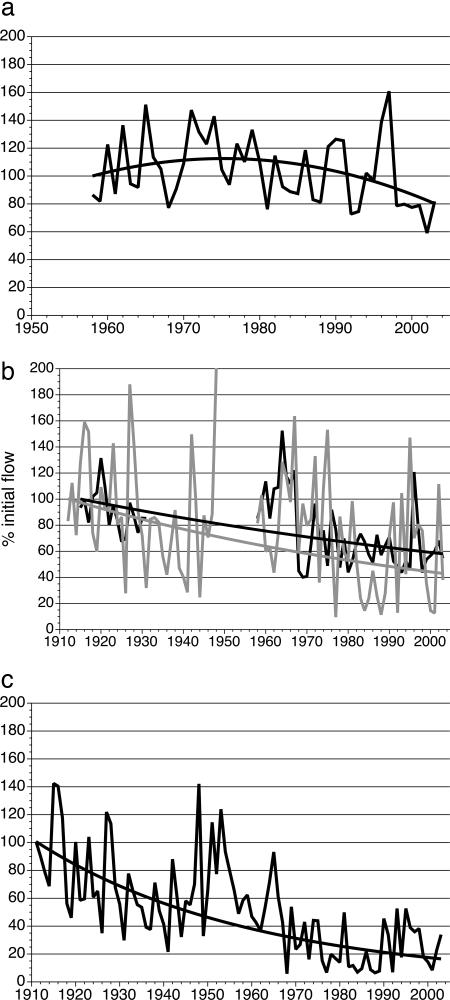
Fig. 2.
Long-term relative change in summer flow (May–August) in major rivers of the WPP. (a) The Athabasca River downstream of Fort McMurray, Alberta (−19.8% from 1958–2003; −33.3% since 1970; P < 0.05). (b) Represented by the black line is the Peace River at the town of Peace River, Alberta (−42.1% from 1915–2003; P < 0.0001), and represented by the gray line is the Oldman River at Lethbridge, Alberta (−57.1% from 1912–2003; P < 0.0005). (c) The South Saskatchewan River at Saskatoon, Saskatchewan (−83.6% from 1912–2003; P < 0.0001). The smooth lines are regressions representing the best fit to the data for the entire period. The percentage reduction in flow is the change in regressed flow during the period of record.

