
Figure 3(opposite, above).
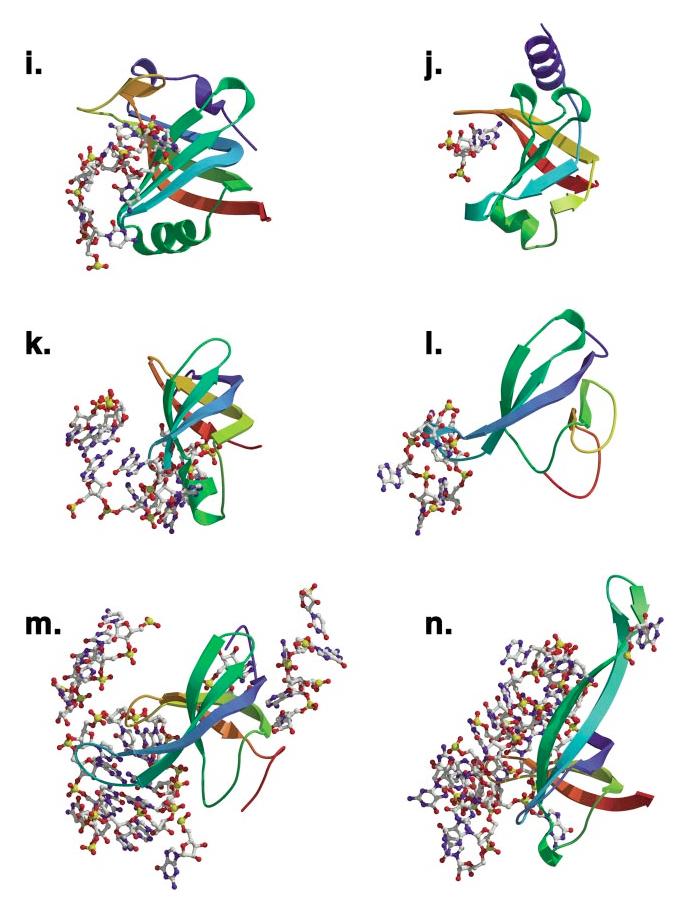
Comparison of ligand binding in the OB-fold domains. The 14 independent OB-fold domains are depicted in a common orientation based on superimposition with the N-terminal OB-fold of RPA. Secondary structure is rainbow colored beginning with violet at the N terminus and ending with red at the C terminus. Nucleic acids that are within 3.5 Å of the relevant fold are rendered as ball-and-stick figures. OB-folds were aligned with LSQMAN. (a) OnTEBP α1, (b) Cdc13, (c) OnTEBP α2, (d) OnTEBP β, (e) RPA-A, (f) RPA-B, (g) EcSSB, (h) RecG, (i) EcAspRS, (j) EcRho, (k) IF1, (l) L2, (m) S12, (n) S17.