
Figure 1.
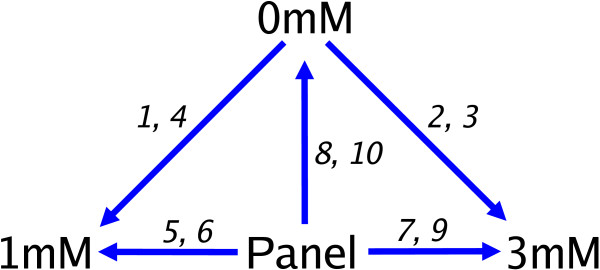
Design of the METH experiment. The METH experiment compared 3 mRNA sources of interest (0 mM, 1 mM and 3 mM) directly on the first 4 arrays and indirectly via a Panel reference on a further 6 arrays. The arrays are numbered from 1 to 10 in the order they were hybridised. Each arrow indicates a direct comparison made within an array, and points from the Cy3 labelled sample towards the Cy5 labelled sample.