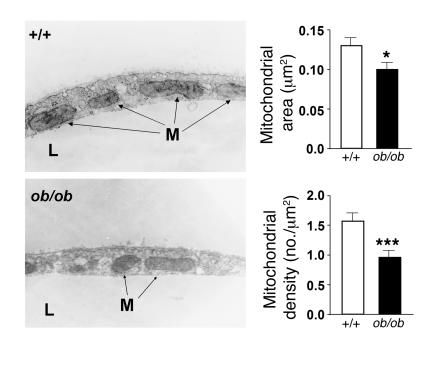
Figure 3. Mitochondrial pattern is altered in WAT of ob/ob mice.
WAT from control or ob/ob mice was processed to perform stereological analysis of mitochondria. The tissues were fixed and sectioned randomly and prepared for electron microscopy. Representative electron micrographs are shown at left. M, mitochondria; L, lipid droplets. At right, 50 photographs at a magnification of ×11,500 were taken, and the area and density of 998 wild-type and 1,112 ob/ob mitochondria were determined. Results are mean ± SEM (n = 3 per group). ***P < 0.01, *P < 0.05.

