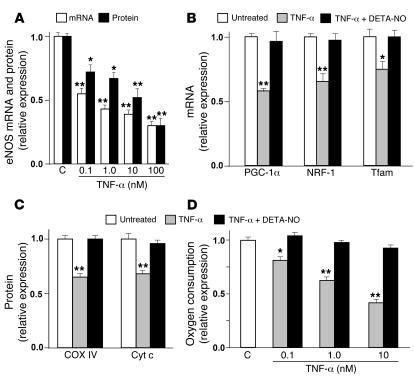
Figure 6. Mitochondrial biogenesis is downregulated by TNF-α and restored by an NO donor in WAT cells.
(A) eNOS mRNA and protein were analyzed by quantitative RT-PCR and immunoblotting, respectively, in untreated cells (C, control) or after exposure to TNF-α at different doses for 2 days. (B) PGC-1α, NRF-1, and Tfam mRNA levels were determined in untreated WAT cells and after treatment with 1 nM TNF-α alone or in combination with 50 μM DETA-NO for 2 days. (C) COX IV and Cyt c protein levels and (D) oxygen consumption were measured in untreated WAT cells and after treatment with 1 nM (C) or different doses (D) of TNF-α alone or in combination with 50 μM DETA-NO for 2 days. Relative values are mean ± SEM (n = 4 different experiments) when control measurements were assigned a value of 1.0. **P < 0.01, *P < 0.05 versus untreated cells.

