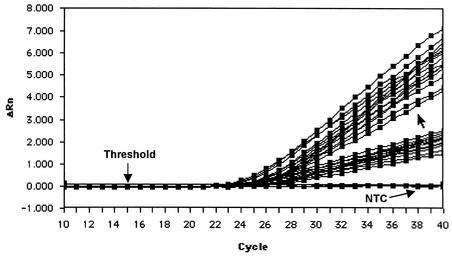
FIG. 2.
Comparison of TaqMan MDV PCR methods 1 and 2 performed with DNA isolated from the leukocytes of 14 of 16 chickens. For a clear arrangement, the results for two chickens with markedly higher CT values were excluded (see Fig. 1B). The amplification plots of methods 1 and 2 are divided by the unlabeled arrow. Method 2 had lower CT values and higher relative fluorescence units (ΔRn) and thus had a higher sensitivity than method 1. NTC, no-template control.

