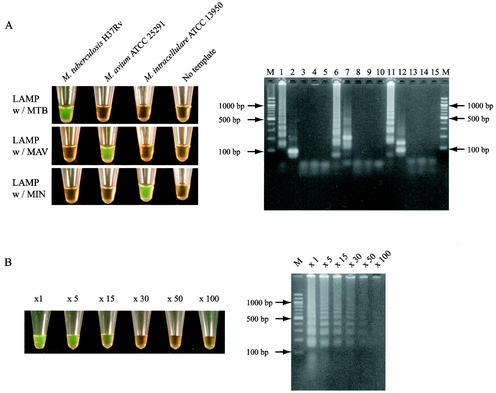
FIG. 2.
(A) Visual inspection and electrophoretic analysis of LAMP amplified products. Lane M, 100-bp ladder used as a size marker; lanes 1, 3, and 4, LAMP carried out with MTB primers in the presence of genomic DNA from M. tuberculosis, M. avium, and M. intracellulare, respectively; lane 2, LAMP product from lane 1 after digestion with BsaI; lanes 5, 10, and 15, LAMP carried out in the absence of template DNA with MTB, MAV, and MIN primers, respectively; lanes 6, 8, and 9, LAMP carried out with MAV primers in the presence of genomic DNA from M. avium, M. tuberculosis, and M. intracellulare, respectively; lane 7, LAMP product from lane 6 after digestion with HaeIII; lanes 11, 13, and 14, LAMP carried out with MIN primers in the presence of genomic DNA from M. intracellulare, M. tuberculosis, and M. avium, respectively; lane 12, LAMP product from lane 11 after digestion with Tth111I. (B) Sensitivities of visual inspection and electrophoretic analysis of LAMP amplified products. The number above each tube or lane represents the dilution of the LAMP product: ×1, no dilution; ×5, 5-fold dilution; ×15, 15-fold dilution; ×30, 30-fold dilution; ×50, 50-fold dilution; ×100, 100-fold dilution.

