
Figure 8.
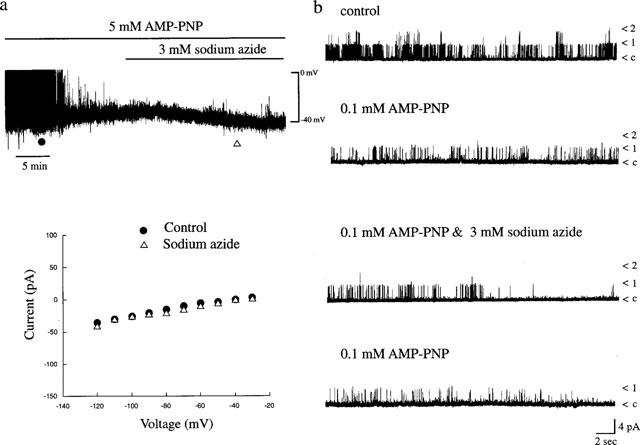
(a) Sodium azide activation of KATP channels is blocked by AMP-PNP. (a) The upper panel is a whole cell current clamp trace of cell dialysed with 5 mM AMP-PNP. Application of sodium azide (3 mM) for the time indicated failed to hyperpolarize CRI-G1 cells. The lower panel is a plot of the current-voltage relations for the voltage clamped currents obtained at the times specified in a: control (•) and sodium azide (▵). Following dialysis with AMP-PNP, sodium azide failed to effect the membrane conductance of CRI-G1 cells. (b). Single channel currents recorded from an inside-out membrane patch exposed to symmetrical 140 mM KCl at a membrane potential of +40 mV. Following application of 0.1 mM AMP-PNP which itself inhibited KATP channels, subsequent addition of sodium azide (3 mM) failed to increase KATP channel activity. The Nf.Po values were as follows: control 0.207; 0.1 mM AMP-PNP 0.087; 0.1 mM AMP-PNP and sodium azide 0.065; washout of azide 0.044.