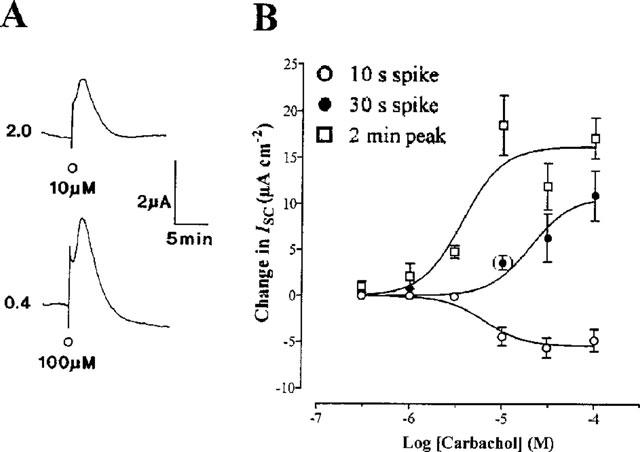
Figure 1.

Responses to CCh in Colony 1 epithelial layers. (A) shows representative traces in which Colony 1 cells in KH buffer were stimulated with 10 μM (upper trace) or 100 μM (lower trace) CCh, with initial baseline currents (in μA) given to the left of each example. In (B) single additions of increasing CCh concentration (0.3–100 μM; n=4–14) are represented as a series of concentration response relationships showing the 10 s downward spike, the 30 s spike and the 2 min transient increase in ISC. A separate 30 s component could not be distinguished after 3 μM CCh and was observed in only a minority of cases (4 out of 14, bracketed value) after 10 μM agonist. EC50 values are quoted in the text.
