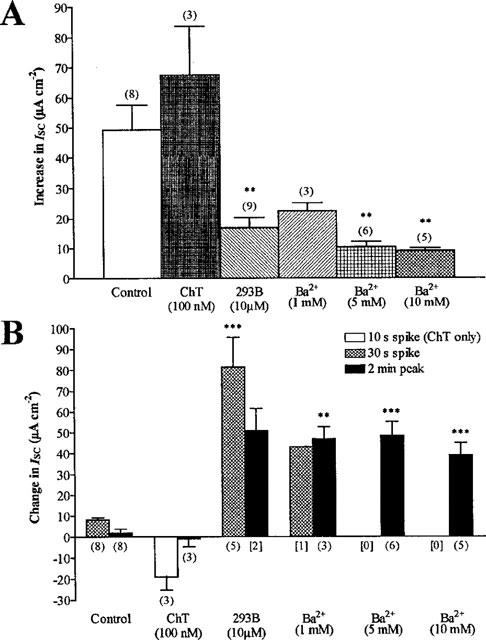
Figure 5.

Inhibition of forskolin-induced ISC increases by K+ channel blockade and the subsequent effects on CCh stimulation. (A) illustrates the effect on 10 μM forskolin responses of 10 min pretreatment with basolateral charybdotoxin (ChT, 100 nM), 293B (10 μM) or Ba2+ (1–10 mM). (B) shows the responses to 10 μM CCh added 30 min after forskolin in the same experiments, with each bar representing the 10 s spike (charybdotoxin treated cells only), 30 s spike and 2 min peak. The total number of observations or the frequency of individual components are indicated in round and square brackets respectively; **P<0.01 and ***P<0.001 compared to controls.
