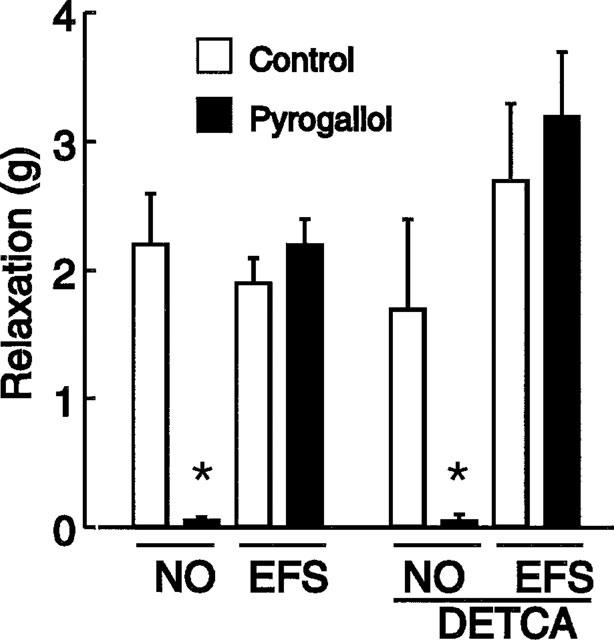
Figure 4.

Effects of pyrogallol (100 μM) on relaxant responses to electrical field stimulation (EFS, 1 Hz) and NO (0.4 μM) in the absence of (left columns) and after treatment with DETCA (3 mM) (right columns). Columns represent means and I-bars are s.e.means, n=4. *Indicates significantly less than corresponding control (paired t-test; P<0.01).
