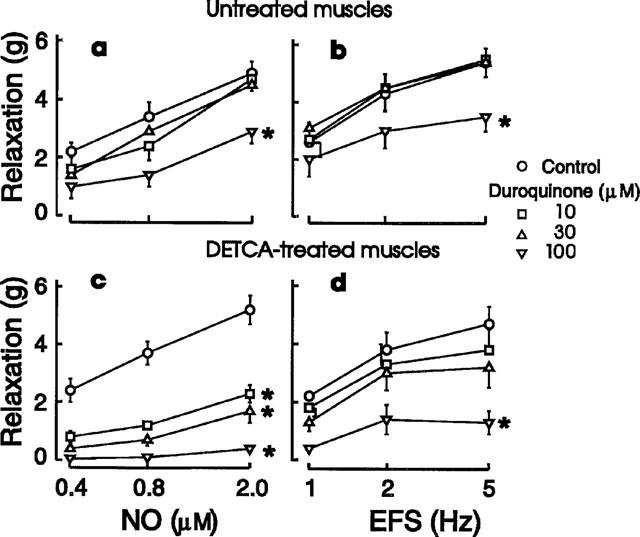
Figure 5.

Effects of duroquinone on relaxant responses to NO (a and c, 0.4–2 μM) and electrical field stimulation (EFS: b and d, 1–5 Hz) in control (a and b) and DETCA-treated muscles (c and d). Symbol represents means and I-bars are s.e.means, n=5 for a and c, and n=4 for b and d. *Curves significantly different from control (ANOVA, P<0.01).
