
Figure 4.
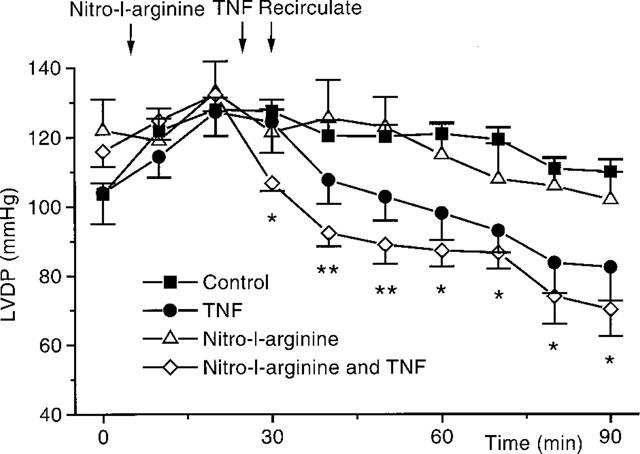
This graph shows the actions of nitro-L-arginine, 100 μM, on the depression in LVDP seen with TNF (n=8). Control hearts (n=13), TNF (n=10), and control hearts in the presence of nitro-L-arginine (n=4) are all shown. *P<0.05, **P<0.01, for TNF with nitro-L-arginine vs nitro-L-arginine alone.