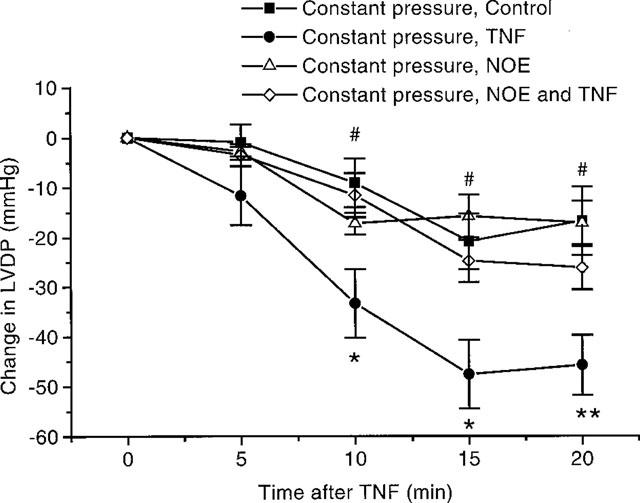
Figure 7.

Effects of NOE on the depression in cardiac function seen with TNF, 20 ng ml−1 under constant pressure conditions. Shown as a change in LVDP after TNF administration (n=6–7). *P<0.05, **P<0.01 TNF vs control. #P<0.05 NOE vs TNF with NOE. Where LVDP at 0 min for NOE treated controls and NOE with TNF treated animals: 107±6 mmHg and 100±5 mmHg respectively.
