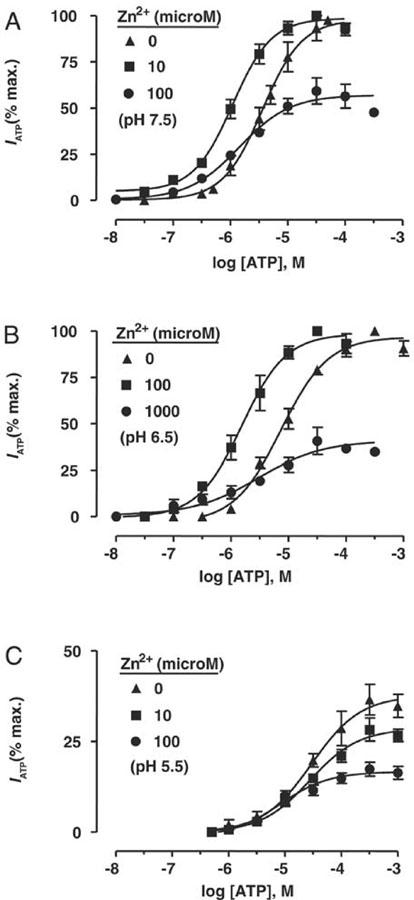
Figure 3.

Interaction of H+ and Zn2+ on ATP activity at rP2X4 receptor. Concentration/response (C/R) curves for ATP at three levels of extracellular pH (in A, pH 7.5; in B, pH 6.5; in C, pH 5.5), in the absence then presence of concentrations of Zn2+ ions that caused potentiation and inhibition of ATP-responses. Zn2+ potentiation was caused by an increase in ATP potency, displacing C/R curves to the left. Zn2+ inhibition was due to a decrease in ATP efficacy, without altering agonist potency. Data points are means±s.e.mean, n=4.
