
Figure 5.
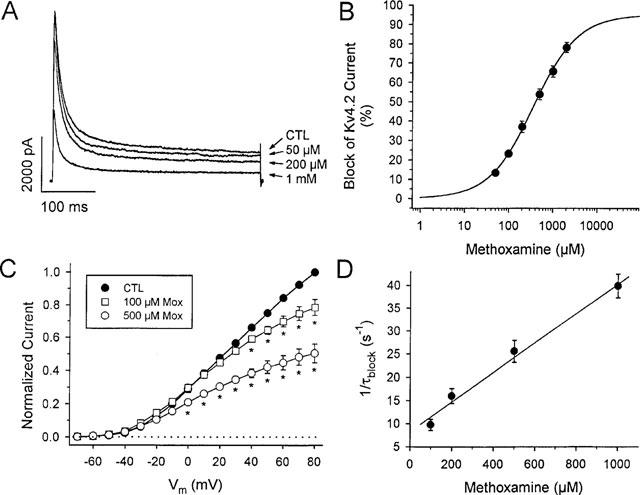
Reduction of Kv 4.2 current by methoxamine. (A) Kv 4.2 transfected HEK cell currents at +60 mV in control (CTL), and in the presence of 50, 200 μM, and 1 mM methoxamine, as indicated. (B) dose-response relation for Kv 4.2 current block by methoxamine. Current was measured at 300 ms and data points are means±s.e.mean (n=6 at each concentration). The solid line was fit to data using equation [1]. The EC50 was 363 μM with nH=0.87, and a maximum expected block of 95%. (C) normalized mean I-V relations for Kv 4.2 current in control (n=6), 100 μM (n=5), and 500 μM (n=6) methoxamine, as indicated. Currents were normalized to control currents at +80 mV, measured at 300 ms. *denotes statistically significant difference from control current amplitude, P<0.05. (D) 1/τblock values plotted vs methoxamine concentration. τblock values were extracted as described in the Methods from fits to the rapid phase of Kv 4.2 decay in the presence of methoxamine. From equation [3a] the best least-squares fit to these data, as indicated by the solid line in Figure 7D, gave an apparent k+1 of 3.2×10⁴ M−1 s−1, and k−1=8.3 s−1. From equation [3b], the calculated Kd was 388 μM. Data are means±s.e.mean (n=5–9 at each concentration).