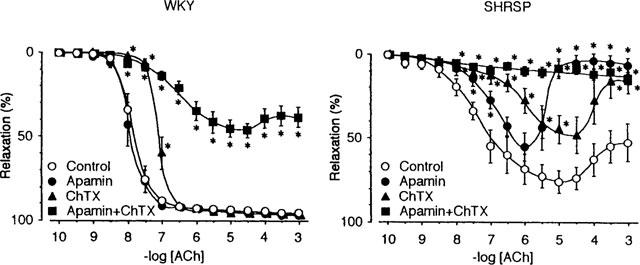
Figure 4.

Concentration-response curves for acetylcholine (ACh) in the presence of L-NOARG and indomethacin, and the effects of apamin and charybdotoxin. Control indicates the relaxation curve in the presence of L-NOARG (100 μM) and indomethacin (10 μM). Apamin, ChTX and Apamin+ChTX indicate curves in the presence of apamin (5 μM), charybdotoxin (0.1 μM) and both, respectively in addition to L-NOARG and indomethacin. Data are means±s.e.mean of 12 preparations. Asterisks indicate significant difference between control value and values in the presence of respective drug or drugs (*P<0.05). The others are the same as in Figure 1.
