
Figure 4.
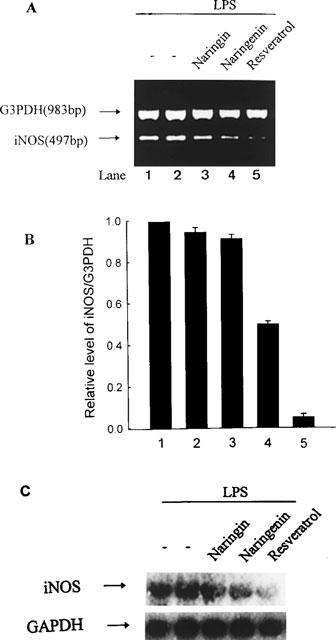
RT–PCR analysis of the expression of iNOS mRNA. (A) RAW 264.7 cells were treated with no flavonoid (lane 1), DMSO (0.03%, lane 2), naringin (30 μM, lane 3), naringenin (30 μM, lane 4), or resveratrol (30 μM, lane 5) before stimulation with LPS (50 ng ml−1) for 5 h. Total RNA was extracted from treated cells and the iNOS mRNA expression was determinated as described in Methods. G3PDH, glyceraldehyde-3-phosphate dehydrogenase. (B) Quantification of the iNOS RNA expression was performed by densitometric analysis (IS-1000 Digital System) of the RT–PCR analysis. Data are expressed as the means±s.e.mean of the ratio of maximal RNA expression observed with LPS in three independent experiments. The ratio of iNOS to G3PDH RNA expression observed with LPS alone is set at 1. The relative level was calculated as the ratio of iNOS to G3PDH RNA expression. (C) Total RNA was extracted from treated cells and assayed for iNOS mRNA expression by Northern blot analysis. Blots were hybridized to 32P-labelled iNOS probe as described in Methods. Signals for GAPDH mRNA for each lane are shown as controls.