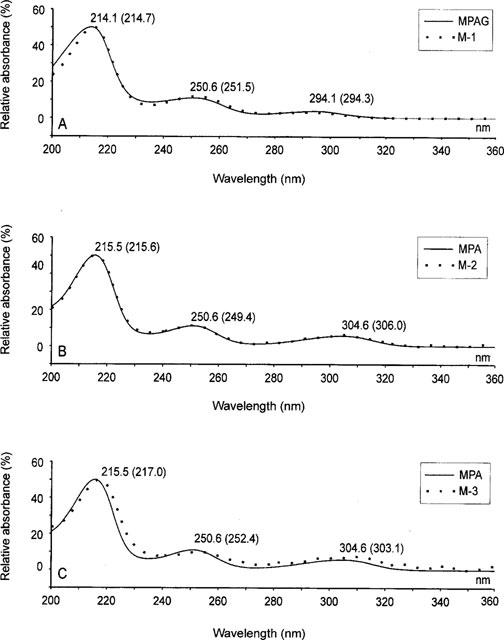
Figure 2.

Comparison of the u.v. spectra of M-1 (A), M-2 (B) and M-3 (C) with those of either MPA (B and C); or MPAG (A). The spectra were determined with a diode array detector and the highest relative absorption maximum for each compound was arbitrarily set at 50%. Spectra were then normalized according to the highest relative maximum. The wavelengths of each absorption maximum are illustrated in the Figure. Values in parentheses correspond to the metabolites M-1, M-2 or M-3 and values not in parentheses either MPA or MPAG.
