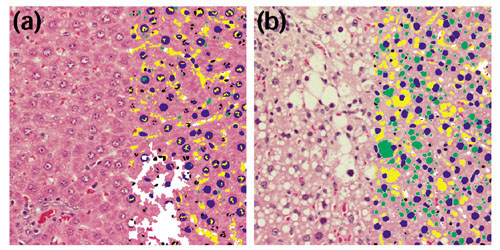
Figure 2.

Microscopic comparison of control and treated livers. Image tiles of (a) the control liver treated with corn oil and (b) a CCl4-treated liver analyzed by an automated microscope system. Identified structures including hepatocyte nuclei (blue), other nuclei (black), clear space (yellow) and vacuoles (green) are indicated by the overlay on the right side of each panel.
