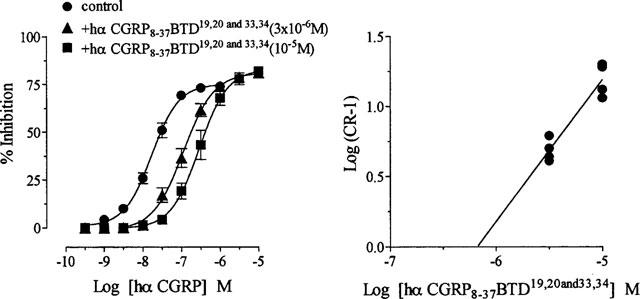
Figure 4.

Effect of replacement by BTD at positions 19,20 and 33,34 in hα CGRP8–37 on hα CGRP responses in rat prostatic vas deferens. Graph (left) showing a concentration response curve to hα CGRP on twitch responses, and in the presence of hα CGRP8–37 BTD19,20 and 33,34 at 3×10⁻⁶M and 10−5M. The Schild plot (right) for hα CGRP8–37 BTD19,20 and 33,34 against hα CGRP. Results on the graph are expressed as percentage inhibition of twitch responses. Points and error bars represent the mean±s.e.mean of four separate experiments. On the Schild plot, points represent individual data of eight separate experiments.
