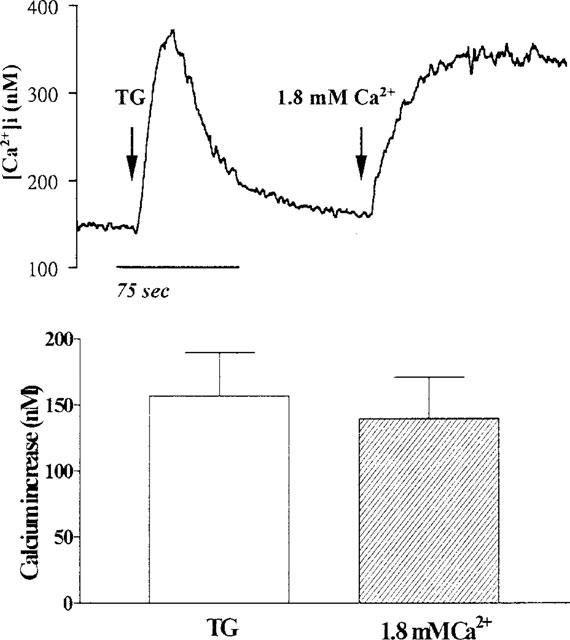
Figure 6.

Effect of TG on [Ca2+]i in TECs. The cells were incubated in Ca2+-free buffer, exposed to TG (10 μM), and then Ca2+ (1.8 mM) was re-added to the buffer, as indicated by arrows. The data expressed as mean±s.e.mean of five separate experiments are shown in bar graph.
