
Figure 2.
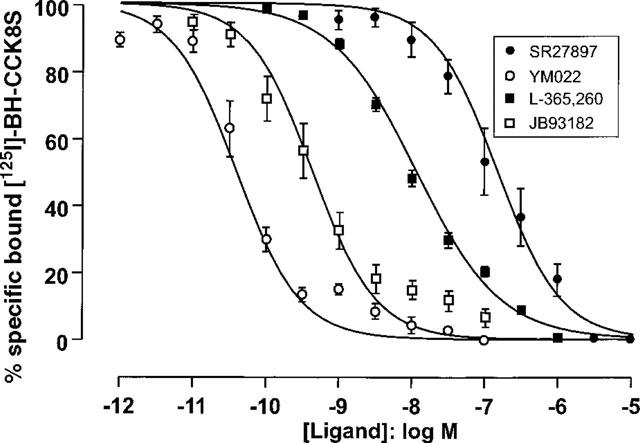
Competition between [125I]-BH-CCK-8S and increasing concentrations of ligands for CCKB/gastrin binding sites in rat cortex. Data represent the mean±s.e.mean of 5–48 experiments (see Table 3) where each point was determined in triplicate. The curves shown superimposed on the mean experimental data points were obtained by simulation using equation (2) where the parameters were set at the mean values estimated by fitting each replicate curve to that equation. The parameters used in the simulation are presented in Table 3.