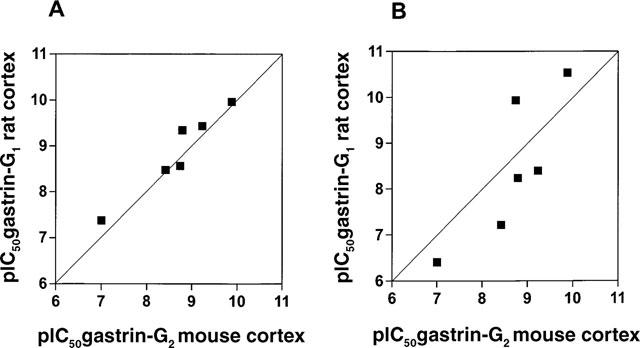
Figure 4.

Comparison of affinity estimates obtained in mouse and rat cortex assays. The line shown superimposed on the data is the line of identity. (A) Comparison of the G2 pIC50 values obtained from the mouse cortex data ([125I]-BH-CCK-8S as radioligand, Table 2) and the G2 affinity estimate obtained from using the two-site model (equation 3) to analyse the individual replicate curve data obtained in the rat cortex (Table 4). The mouse cortex (G2) pIC50 values were indistinguishable from the G2 pIC50 values estimated from the two-site model fit of the rat cortex data (F(6,12)=3.31). (B) Comparison of the G2 pIC50 values obtained from the mouse cortex data ([125I]-BH-CCK-8S as label, Table 2) and the G1 estimates obtained using the two-site model (equation 3) to analyse the individual replicate curve data from the rat cortex (Table 4). The mouse G2 pIC50 values were significantly different from the rat G1 pIC50 values (F(6,12)=30.91).
